

The cement industry faces unprecedented changes over the next 25 years as it decarbonises. However, many of the factors that will have a large impact by 2050 are still at an early stage, while the timing of their impact is uncertain. This article looks at what their impacts might be and challenges the assumptions behind some of the more commonly cited long-term forecasts.
In 2024, a World Cement Association (WCA) member remarked that there was no available forecast for clinker demand in light of the impact of new technologies on clinker-free cements and the increasing use of supplementary cementitious materials (SCMs) and other clinker substitutes in cement.
A forecast for clinker demand is crucial, as it will help the sector to estimate its need for carbon capture and storage (CCS) installations, which are very capital intensive. Having a realistic view of the likely requirements is therefore critical for policy-makers and cement producers.
Conventional demand outlooks
In an excellent report that set out the challenges faced by our industry, the Energy Transitions Commission referred to the International Energy Agency’s (IEA) 2018 report, which stated that the current global cement demand of ~4.2Bnt/yr is forecast by the IEA’s Reference Technology Scenario to grow to 4.7Bnt/yr by 2050. This represents an increase of 12% from 2020 levels. Meanwhile, the Global Cement & Concrete Association’s (GCCA) underlying assumption in its Concrete Future roadmap is a ‘Business as Usual’ increase in CO2 emissions from cement production, from 2.7Bnt/yr in 2020 to 3.8Bnt/yr in 2050.
For reasons that I will outline later in this article, the WCA is of the opinion that these forecasts of significant growth are unlikely. Indeed, in its latest forecast, the IEA now projects flat cement demand (at 2020 levels) until 2035, followed by a 5% decline by 2050. WCA’s estimate for cement demand in 2024 already shows a 9% reduction compared to 2020. It now expects a further decline in cement demand of 22% by 2050, resulting in a level of 3.0Bnt/yr in 25 years’ time.
‘Business as Usual’ projections
In this context, ‘Business as Usual’ (BAU) refers to projections for cement demand before considering new developments that will reduce the demand for conventional, i.e.: Portland clinker-based cements. These include the replacement of concrete with other materials such as timber, the use of Portland clinker-free binders, design optimisation and improved resource efficiency. To assess likely demand, WCA has defined four types of markets, as shown in Table 1.
Table 1: Split of global cement markets into four types
| Market Type | Share of Global Cement Consumption (%) | Regions | |
| 2024 (E) | 2035 (F) | ||
| 1. China: Decline then stable | 48 | 32 | China |
| 2. Developed markets: Broadly stable | 13 | 13 | NE Asia, Europe (incl.Türkiye), N America, Oceania |
| 3. Middle-income nations: Slow and steady | 22 | 26 | CIS, M East, N Africa, Latin America, SE Asia |
| 4. Emerging markets: Rapid growth | 18 | 28 | South Asia, Sub-Saharan Africa |
China: Decline then stable
In 2020 China saw cement demand of 2.4Bnt, representing 57% of all cement consumed globally in that year. Indeed, this ratio has remained roughly stable since 2014. This represents per-capita consumption of 1700kg/capita, far above the average of 300kg/capita in the rest of the world.
A comparison with other East Asian economies is instructive. In both Japan and Taiwan consumption dropped rapidly from their peaks of 700kg/capita and 1000kg/capita to around 350kg/capita and 500kg/capita respectively. However, South Korea is perhaps the closest comparison to China, with a peak of almost 1400kg/capita before the 1998 Asian Financial Crisis. The country has since maintained a level of ~850kg/capita. However, the drop in China is likely to be more pronounced (as a percentage of peak demand) for two main reasons:
1. The Chinese peak was sustained over eight years and the resulting cumulative consumption is significantly higher than South Korea’s at its peak;
2. The Chinese government brought forward many infrastructure projects to prop up demand in the past five years due to lower GDP growth, bringing forward some demand from the next 5 - 10 years.
Indeed, cement demand in China fell by almost 25% from 2.4Bnt in 2020 to 1.8Bnt in 2024, an average decline of 7%/yr. WCA expects demand to continue to fall by 3.9%/yr to reach 1.2Bnt in 2035, a halving of demand in just 15 years. The decline will then decellerate to 1.6%/yr to reach 0.9Bnt by 2050, reflecting both lower per-capita consumption and a rapid decline in China’s population.
Developed markets: Broadly stable
The markets considered here include the largely developed markets in Europe (including Türkiye), North America, North East Asia and Oceania. Combined, they represent just 13% of global demand for cement. Türkiye and some East European countries are still benefiting from enhanced demand from their development booms, but the impact of this is modest and will fade entirely by 2050. Demand growth is expected in North America and Oceania due to population growth, but declines are expected in North East Asia and Western Europe due to population declines. In 2024, these developed markets are estimated to have demanded just under 0.5Bnt of cement, a level they are expected to maintain over the entire period to 2050.
Middle income nations: Slow growth
Middle-income countries, including those in the Middle East, North Africa, Latin America, CIS and Southeast Asia, will experience steady growth from 0.84Bnt in 2024 to 0.95Bnt in 2035 and 1.03Bnt in 2050. This represents an average growth rate of 0.8%/yr, slightly ahead of population growth, which is forecast to be 0.7%/yr. This is a heterogeneous group with different trends in different countries. Population growth varies considerably as does the stage of development.
Some countries, including Saudi Arabia and the UAE, will reach a stage of development where cement consumption will start to decline. Others, such as the central Asian republics, will continue to experience rapid population and per-capita consumption growth due to ongoing development.
Emerging markets: Rapid growth
Emerging markets in South Asia (including India) and Sub-Saharan Africa will see rapid growth in cement demand, almost doubling from 0.69Bnt in 2024 to 1.22Bnt in 2050, while population grows by 40% from 3.1Bn people to 4.4Bn. Per-capita consumption will increase from 220kg/yr to 280kg/yr, almost reaching Western European levels.
The pressure to decarbonise
The granular picture outlined in Table 2 reveals why current BAU forecasts are likely to be wrong and explain why the WCA’s estimate for cement consumption in 2050 is 3.6Bnt/yr. However, this is not the whole picture, as the pressure to decarbonise means we should not expect BAU to continue. Everyone in the cement industry is now aware of the ever-increasing pressure to reduce CO2 emissions. Over the past 30 years the industry has cut per-tonne emissions by about 25%. However, the sector’s customers are also under pressure to cut the CO2 footprint of their projects, often faster than the cement industry can satisfy. This will lead them to take actions that will reduce the demand for conventional cement.
There have been several well publicised high-rise buildings that have used timber to replace concrete and steel. No doubt we will see more of this in the future. However, limitations in the supply of sustainable timber mean this will not replace a significant portion of concrete. Allied Market Research published an analysis of the mass timber construction market in 2023, which estimated a growth rate of 6%/yr between 2025 and 2035.
However, there is considerable waste in the concrete supply chain, where cement is ultimately put to use. In ready mixed concrete supply, this involves over-ordering and then dumping or returning excess concrete. In site mix supply, this involves using more cement than the mix design requires, as well as spillage and dust losses. In addition to the reduction of waste, there is considerable potential to reduce binder demand with greater use of admixtures and the addition of novel materials such as graphene and carbon nanotubes.
Current design practices have been based on cost considerations. As engineers and architects take into account the embodied CO2 emissions, there will be reductions in the amount of concrete used to achieve specific objectives. The potential savings have been estimated at greater than 20%.
However, there may be easier ways to reduce embodied CO2. Many companies are developing non-clinker binder systems, mainly based on geopolymer concretes that include steel slag, ash, mine tailings and other industrial by-products, as well as calcined clays. These are likely to be accepted initially for non-structural and sub-surface applications. These applications, which typically use C30 or standard grade concrete and have low risk/loss in the case of failure, are estimated to amount to more than 50% of all concrete used. They thus present a significant opportunity to reduce CO2 emissions.
Table 2: BAU projections for cement demand
| Market Type | Region | Cement Consumption (Mt/yr) | |||
| 2020 | 2024 (E) | 2035 (F) | 2050 (F) | ||
| 1. Decline then stable | China | 2411 | 1825 | 1183 | 928 |
| 2. Broadly stable | North America | 115 | 120 | 131 | 138 |
| Western Europe | 131 | 126 | 129 | 125 | |
| Eastern Europe and Türkiye | 120 | 127 | 129 | 98 | |
| Oceania | 12 | 12 | 13 | 14 | |
| North East Asia | 97 | 97 | 89 | 85 | |
| 3. Slow growth | South East Asia | 236 | 240 | 275 | 297 |
| North Africa | 93 | 97 | 111 | 131 | |
| Latin America | 164 | 176 | 202 | 215 | |
| CIS | 97 | 116 | 127 | 136 | |
| Middle East | 196 | 208 | 235 | 254 | |
| 4. Rapid growth | South Asia (incl. India) | 392 | 537 | 771 | 908 |
| Sub-Saharan Africa | 130 | 153 | 207 | 308 | |
| TOTAL | 4194 | 3834 | 3602 | 3637 | |
Scenarios considered
Because of the uncertainty over if, and when, the factors above will play a significant role at scale, it is hard to quantify their impact precisely. However, it is clear they will reduce demand for traditional OPC-based cement even further. The WCA has therefore outlined three potential scenarios:
Scenario 1 - Slow change: There is progress on all issues but no step change in the rate of adoption from that seen at present;
Scenario 2 - Central forecast: The potential of new technologies will be fully realised in developed markets by 2050, with an ongoing transition elsewhere;
Scenario 3 - Rapid change: The full potential of carbon-saving technologies will be realised globally.
Table 3: Assumptions made in WCA’s three forecast scenarios (Change 2020 v 2050)
| Factor | Scenario 1 - Slow change | Scenario 2 - Central forecast | Scenario 3 - Rapid change |
| Loss of market to timber | 0.04 | 0.05 | 0.06 |
| Reduction in supply chain waste | 0.06 | 0.08 | 0.12 |
| Design optimisation | 0.02 | 0.05 | 0.15 |
| OPC clinker-free cements | 0.02 | 0.08 | 0.15 |
Table 4: Projections for global cement demand in 2035 and 2050 under three scenarios
| Factor | Historical Situation | Scenario 1 - Slow change | Scenario 2 - Central forecast | Scenario 3 - Rapid change | ||||
| 2020 | 2024 (E) | 2035 (F) | 2050 (F) | 2035 (F) | 2050 (F) | 2035 (F) | 2050 (F) | |
| BAU cement demand | 4194 | 3834 | 3634 | 3637 | 3643 | 3647 | 3643 | 3637 |
| Loss of market to timber | 36 | 145 | 55 | 182 | 73 | 218 | ||
| Reduction in supply chain waste | 73 | 218 | 109 | 291 | 146 | 436 | ||
| Design optimisation | 36 | 73 | 73 | 182 | 146 | 546 | ||
| Adjusted cement demand | 3498 | 3200 | 3407 | 2982 | 3297 | 2437 | ||
| Clinker-free cements | 25 | 73 | 49 | 291 | 74 | 546 | ||
| Conventional cement | 3473 | 3127 | 3358 | 2691 | 3206 | 1891 | ||
Forecasts that include disruptive factors
In WCA’s view, the cement industry has not widely recognised the forces outlined above and the possible resulting impact on cement demand. This could see a reduction from 4.2Bnt in 2020 to 2.4Bnt in 2050. This would have a major impact on supply/demand balance, pricing and profitability.
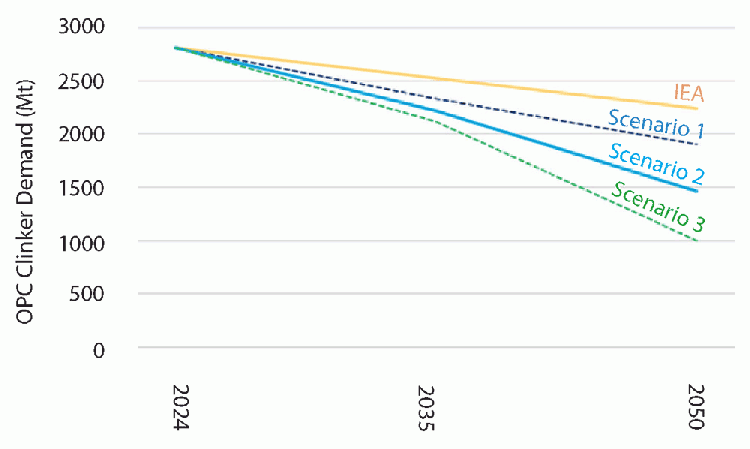
If we look at actual demand trends between 2020 and 2024, the downward trend in cement demand (including clinker-free cements) is more rapid than in Scenario 2. However, cement demand is not the full story as far as the industry is concerned. In addition to the reduction in demand for conventional cement, we can also expect a continued reduction in the clinker factor. Scenario 2 is based on a 1%/yr increase in SCM use between 2024 and 2035, followed by an increase of 0.5%/yr from 2035 to 2050. This would result in a reduction in clinker factor from 73% in 2024 to 66% in 2035 and 54% in 2050. For comparison, the IEA forecast is 61% in 2035 and 57% in 2050.
The impact of CCS
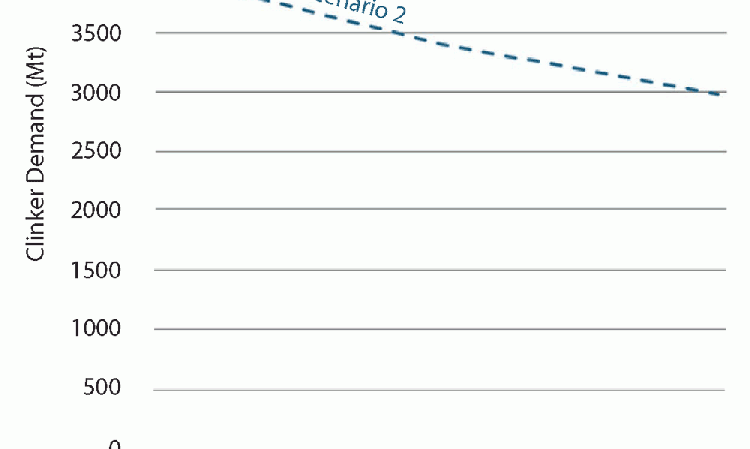
For the cement industry, the worst option to reduce carbon emissions is CCS. It is expensive and energy intensive and projects involve a wide range of parties, which makes coordination complex. Furthermore, projects take a long time and often suffer delays. However, we do not have another way of reducing emissions all the way to zero.
The forecast for clinker demand is therefore critical to calculating what the demand for CCS will be. In 2024 clinker production is projected to be 2.8Bnt, a drop of 370Mt from its 2020 peak in just four years. This is projected by the WCA to fall to less than 1.9Bnt by 2050, possibly to as low as 1.0Bnt. This has significant implications for demand for CCS equipment and may be cause for optimism. Indeed, this reduction may be sufficient to allow full implementation of CCS solutions in the cement sector far more readily over the next 25 years than the sector has traditionally anticipated.
The effect on CO2 emissions
Clinker production is the main source of cement industry CO2 emissions. Today, around one third of emissions come from burning fuel and two thirds are from the decomposition of limestone. As the cement industry moves from coal to lower-CO2 fuels like post-consumer-derived fuels and biomass, the fuel emissions per tonne of clinker will be reduced. WCA anticipates that the industry average specific fuel emissions will reduce by nearly 70% by 2050. Accordingly, the projected gross CO2 emissions from cement production before CCS are forecast to fall from 2.4Bnt in 2024 to less that 1.0Bnt in 2050.
Conclusions
The cement industry faces changes on a scale it has not seen in the past and no forecast can be
considered definitive. However, what is clear is that demand for cement - and clinker in particular - will decline substantially. The decline of clinker demand to perhaps half of current levels is a huge challenge for the cement industry. Most of the capital invested in cement plants is in the kiln systems to produce clinker. Global capacity utilisation is currently ~65%. Taking account of expansions that are already being considered, we can expect at least 500Mt/yr of new capacity to come online, mostly in emerging markets. In Scenario 2, kiln utilisation could be as low as 30% by 2050.
These changes also present a big opportunity. Concrete is used in huge quantities because it is an excellent, long-lasting material - and cheap too. The future offers the prospect of greater customisation not only to reduce embodied carbon but also to tailor concretes to the requirements of individual applications. This is a future in which the most agile and forward-looking companies will prosper.
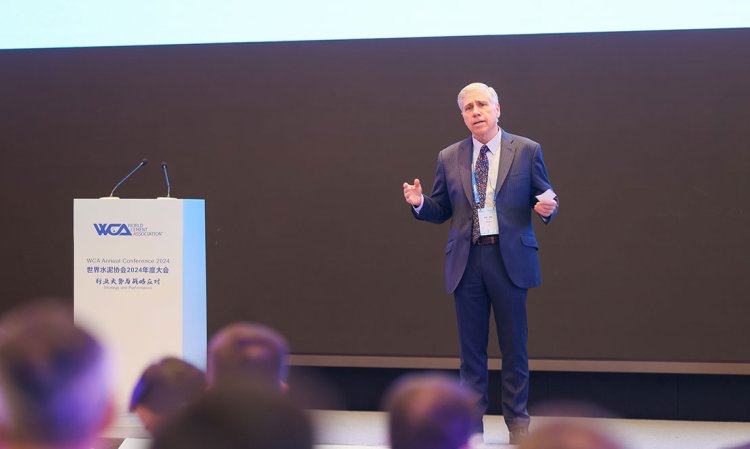
About Ian Riley
Ian Riley was appointed CEO of the World Cement Association in September 2019. Earlier, he held management roles in the UK, the US, Australia and Japan before moving to China in 1998. He entered the cement sector in 2006 with Huaxin Cement and became Greater China Country Head for LafargeHolcim (now Holcim) in 2014.


