

It seems that new plants, grinding stations and capacity upgrades are announced almost daily in the cement sector, often in the face of chronic overcapacity. This intriguing situation piqued the interest of OneStone Consulting’s Joachim Harder and led to the development of Cement Projects Focus 2022, OneStone’s latest multi-client report for the cement sector. Here we ask him about the report’s contents...
Global Cement (GC): What led you to publish the new report Cement Projects Focus 2022?
Joachim Harder (JH): In the cement industry there is no other issue subject to as much misinformation as cement capacity utilisation outlined globally, by region and by country. We studied several reports from sources like Exane BNP Paribas, Deutsche Bank Markets Research and HSBC Global Research. Such studies from 2006 to 2017 came to very different conclusions, with very different projections. For us the question was: ‘How can this be?’ and more interestingly, ‘How was the data generated?’
As the data was very surprising to us, we carried out an independent research based on data from cement associations, cement producers, country analysts and other relevant third-party sources. We backed up this information with our own research about capacity additions from project information of cement producers and investors, reference lists of suppliers and others.
Our research comprises cement production figures, operational cement capacity figures and the related capacity utilisation from 2005 to 2016, country by country for all countries with cement capacities larger than 1Mt/yr in 2016. This was combined with the data from cement capacity expansion projects 2017 to 2022 for a projection of the capacity utilisation rates in 2018.
Known capacity reductions and plant closures were taken into account. For the outlook of cement production in 2018, our independent research mainly used data from the leading cement producers and correlated this with per capita consumption rates, economic growth rates and construction forecasts.
GC: What are the major findings?
JH: Globally (excluding China), almost 420 cement capacity expansion projects with a combined new cement capacity of 580Mt/yr have been identified as due to be commissioned between 2017 and 2022. The projects were mainly derived from project announcements of cement companies and third parties as well as the reference lists and the achievement records of major suppliers. In cases where information from company records was not comprehensive enough, an intensive research, including expert interviews, was carried out to verify such data. All kinds of projects are being implemented: new greenfield plants, new lines, separate grinding plants and modernisation/upgrades of existing kiln lines.
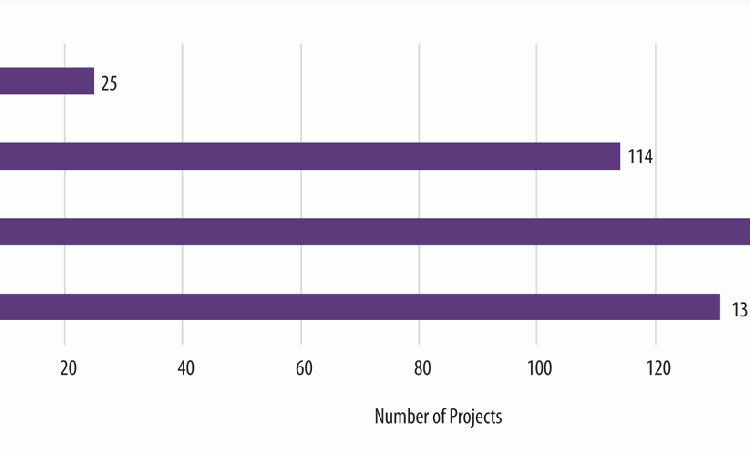
Figure 1 shows a breakdown of these projects. Greenfield projects are leading by the number of projects (150) and by new capacity (250Mt/yr). There are also 131 new grinding projects, although the combined capacity of these projects is less than 100Mt/yr. Furthermore, 114 new production lines at existing sites, with 220Mt/yr of new capacity are in the pipeline, as well as some 25 modernisation projects. There are only relatively few ‘announced’ modernisation/upgrade projects, because these typically have a much shorter lead time from the order to commissioning. For the same reason, it can be expected that the real number of separate grinding projects will be much higher during the period under review.
GC: What is changing in terms of cement sector projects?
JH: Instead of just new greenfield plants and new kiln lines, more separate grinding plants are being installed. Such grinding plants have capacities of 0.1 - 2.0Mt/yr and offer new cement capacities for a fraction of the cost of new integrated plants. The average costs for medium-sized grinding plants are in the range of US$60/t of capacity. The trend of decreasing clinker factor is a strong driver of this, as is the option of installing grinding plants close to the markets.
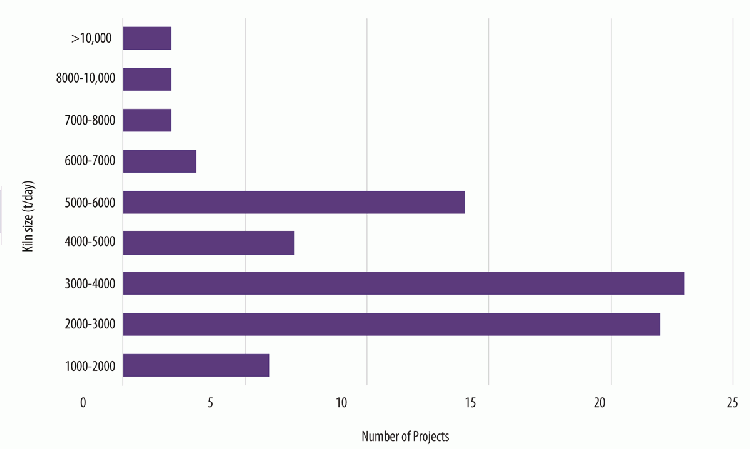
Disciplined investment has become one of the major trends in the cement industry. Today, invested capital is measured by comparing a company’s return on invested capital (ROIC) with its weighted average costs of capital (WACC). If in the cement industry the ROIC > WACC by the third to fifth year of operation, then the business is regarded to generate value. Global cement majors have installed these criteria and thus created the disciplined capital expenditure approach. An outcome of disciplined investments, as shown by our analysis of the kiln capacities of the projected new integrated plants (Figure 2), is that the trend to ever larger kiln lines is obviously coming to an end. The highest numbers are for kiln sizes up to 3000t/day, 4000t/day and 6000t/day. Only a few kilns with capacities larger than 8000t/day are in the pipeline. We expect that large over-capacities and limited export opportunities are behind this trend.
GC: Where are projects set to come online the most?
JH: Your readers will appreciate that I don’t want to go into too much detail here, but I like to explain the example of so-called ‘open’ projects. Projects are classified as open as long as no supplier is named or allocated. In total, there are 123 open projects with a combined capacity of about 170Mt/yr to be commissioned/delivered from 2018 to 2022, of which 53 are greenfield projects.
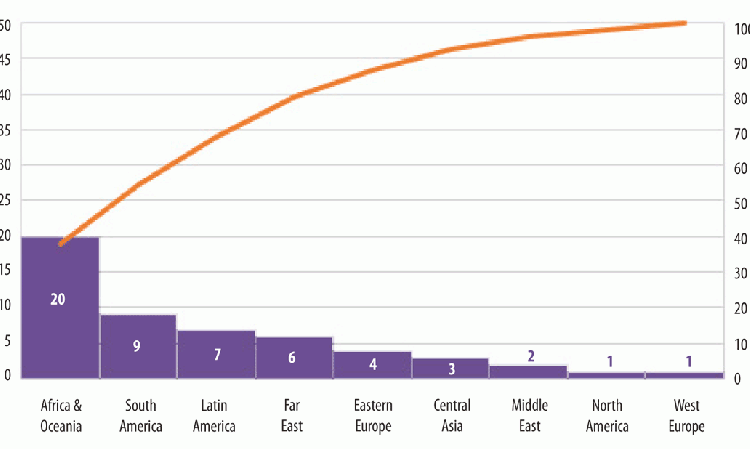
Figure 3 gives an example of the capacity breakdown of the greenfield projects by region. Most of these projects are in Africa/Oceania, followed by South Asia and Latin America, while only a few projects are in Western Europe (including Turkey), North America and the Middle East. The Far East and Eastern Europe are in between. Africa/Oceania will also dominate the new capacity expansion by greenfield projects, with about 30Mt/yr.
GC: Where will project numbers decline?
JH: Obviously in China, but that market was not the subject of our market report. If we compare the five year period from 2018 to 2022 with the five years period from 2013 to 2017 definitely there are less projects in Europe, the Middle East, Latin America and North America.
GC: Why are projects continuing to come online despite the overcapacity?
JH: Our report shows the development of the capacity utilisation rates for the period 2005 to 2018, country by county, together with the cement production and capacity development. Often companies do not have accurate data like this available when investment decisions are made. Furthermore investment in new capacity is often still based on excessive market demand and export expectations. Projects are also carried out in the anticipation that new and modern technology will be more efficient than the older existing technology.
Disciplined investment is also not always an issue. For example, after China’s investment-driven cement economy was recently replaced by a consumption-driven economy, Chinese investors are continuing their investment-driven approach outside China in combination with the ‘One Belt, One Road’ strategy. The large number of new plants being projected by Chinese cement companies and investors in the Far East, in Central Asia and Africa is alarming for many local players. There are also many other illogical factors in decision making. If one company announces an investment, often the main competitor also invests, to ‘keep market share’ or to stay as Number 1 in a country. This can be seen in several countries.
GC: Will all of the capacity you identify actually be realised or will feedback help slow things down?
GC: We allocated probability categories to all projects in order to enable further analysis. It was also taken into account whether the projects are still open or closed, depending on whether there is a supplier in place. We grouped the projects into four categories from 40 to 100%. 40% is when the project are still in a feasibility stage, 60% covers projects in the planning stage, 80% denotes under construction and 100% is when the project is delivered. However, there are individual aspects which can upgrade or downgrade the probability.
When we applied the probability rates just to the 2018 projects, we found that of the total of 107 projects planned to be commissioned this year only 95 have a 80-100% probability for becoming operational. The interesting fact is that projects identified by us have a higher probability than those identified by third parties.
GC: Thank you for your time today.
JH: You are very welcome!


