


CO2 reduction initiatives have been in the forefront of most of the major cement manufacturers for several years. This is natural, as our industry is responsible for 7 - 8% of global emissions. Indeed, it is one of the most CO2-intensive industries in the world. It has rightly attracted a lot of attention.
Currently, the only meaningful carbon reduction framework is the EU ETS (and recently the UK ETS). In January 2021 the EU ETS entered its Phase IV. The combination of the onset of Phase IV and the increased level of CO2 pricing is beginning to influence a large part of cement manufacturers’ strategies.
CemBR published its first report on carbon and cement in October 2019. It is now working on the follow up to the original report. The EU ETS & Cement – Enter the Phase IV report is scheduled to be published in February 2022.
This article is the first of three that CemBR will publish to provide data, insights and analysis based on the report. It concerns the changes to free allowances and the resultant implications for the entire European cement industry. The second and third articles will look at implications for individual markets within the EU ETS and at the forthcoming Carbon Border Adjustment Mechanism (CBAM).
What happened in Phase III?
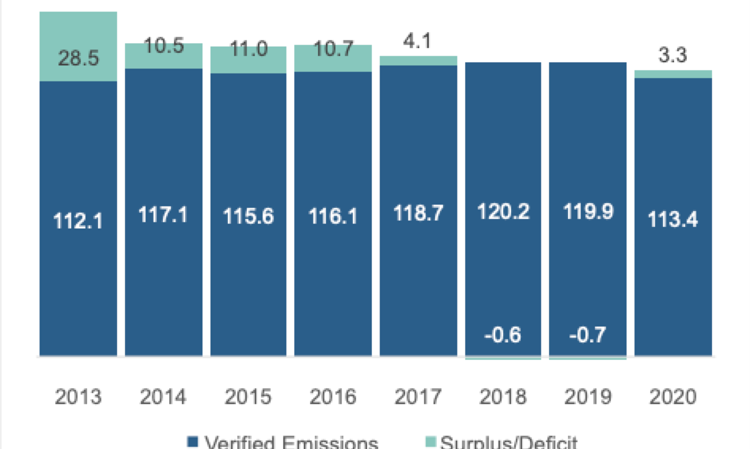
The increasingly stringent requirements of the EU ETS system have started to show their effect already from Phase III, when in two instances (2018 and 2019) the activities covered by the EU ETS produced more carbon than they received in free allowances (Figure 1). The Covid-19 pandemic caused clinker production to fall in 2020, allowing the system to return to a surplus during that year.
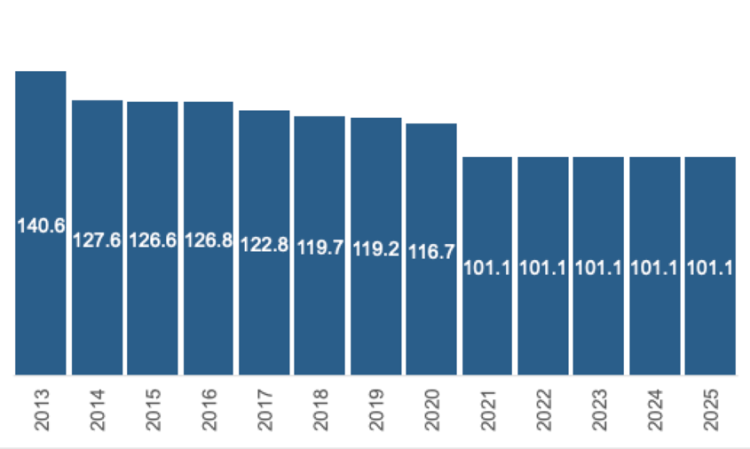
In 2021 all clinker plants within the EU ETS (and UK ETS) received carbon allowances that are in total 13% lower than 2020. These allowances will only change between 2022 and 2025 if there is an adjustment in accordance to the Phase IV rules. There is no benchmark reduction until 2025.
For the period between 2021 and 2025 the total carbon free allowances for the operational clinker plants in Europe (and the UK) are in the order of 101.1 Mt. At the same time, CO2 prices were Euro53.70/t on average in 2021 and Euro80/t at the beginning of 2022 (UK ETS prices are slightly different).
What does this mean for the industry?
If European cement manufacturers choose to curtail production to a level that no further CO2 purchases are required would mean that in 2021 the industry would have produced around 125.7Mt of clinker. The same volumes would have to be produced in 2022. This production would have led to a clinker capacity utilisation rate of 63.2%.
However, clinker production in 2020 was 140.7Mt. This resulted in a clinker capacity utilisation rate of around 70%. So, to avoid purchasing any further carbon credits, the industry would have to drop utilisation rates from 70% to 63%. This would not be distributed uniformly across all countries and all plants in Europe. The report provides details on a plant-by-plant basis examining the differences between all operational plants in Europe.
Costs and impact of Phase IV
Realistically, one cannot expect the industry to reduce clinker utilisation rates by such a large margin between 2020 and 2021/2022. Unless the industry accelerates closures of several plants. So, another, perhaps more realistic scenario would be that the industry continues to produce at 2020 levels. In this case, there is a significant cost associated with purchasing further carbon credits.
| Indicator | 2021 | 2022 |
| Production at 70% Utilisation Rate (Mt) | 145.3 | 145.3 |
| CO2 Permit Price (Euro/t) | 53.7 | 80 |
| CO2 Cost for Production 70% Utilisation Rate (Millions of Euro) | 870 | 1290 |
Table 1: CO2 costs under Phase IV in 2021 and 2022. Source: CemBR Research and Analysis.
NB: This assumes that there will be no adjustments when the 2020/2021 re-evaluations take place. This is not an unrealistic assumption as the industry has already adjusted its 2021 allowances using the 2019/2020 production figures. The report details all the 2021 adjustments within the EU ETS.
Under this scenario, and in order to recover these costs the industry as a whole would have to increase cement prices on the total volumes of sales. Some of the countries would have to implement price increases in some cases above Euro10/t of cement in 2022 compared to 2020.
There are two fundamental observations here. The first is that these price increases only recover the carbon costs, but do not maintain the industry margins. In other words, the industry would need a higher price increase to be able to maintain margins (everything else being equal). Secondly, the carbon costs and the potential price increases will be different both between countries and between plants. A detailed analysis on required price increases by country is presented in the report.
Every plant in Europe will have to define its own strategy regarding carbon costs, but some plants are better positioned than others in terms of free carbon allowances and their ability to produce clinker at higher levels. The sum of the plants’ strategies will then define the country picture as we move further into Phase IV.
In the next article CemBR will address the different positions of all country members of the EU ETS and their relative position vis-à-vis Phase IV.


